Functions to create color and fill scales using AidData's color palettes. These functions implement William & Mary's brand guidelines in a way that works well for data visualization.
Usage
scale_color_aiddata(palette = "default", reverse = FALSE, discrete = TRUE, ...)

scale_fill_aiddata(palette = "default", reverse = FALSE, discrete = TRUE, ...)
Arguments
- palette
The name of the palette to use:
"default","one_color"through"five_colors": Categorical palettes with 1-5 colors"sequential_green","sequential_gold": For ordered data"diverging_green_gold","diverging_vine_sky": For data with meaningful center point
- reverse
Boolean indicating whether to reverse the palette order
- discrete
Boolean indicating whether the scale is discrete (TRUE) or continuous (FALSE)
- ...
Additional arguments passed to discrete_scale() or scale_color_gradientn()
Examples
library(ggplot2)
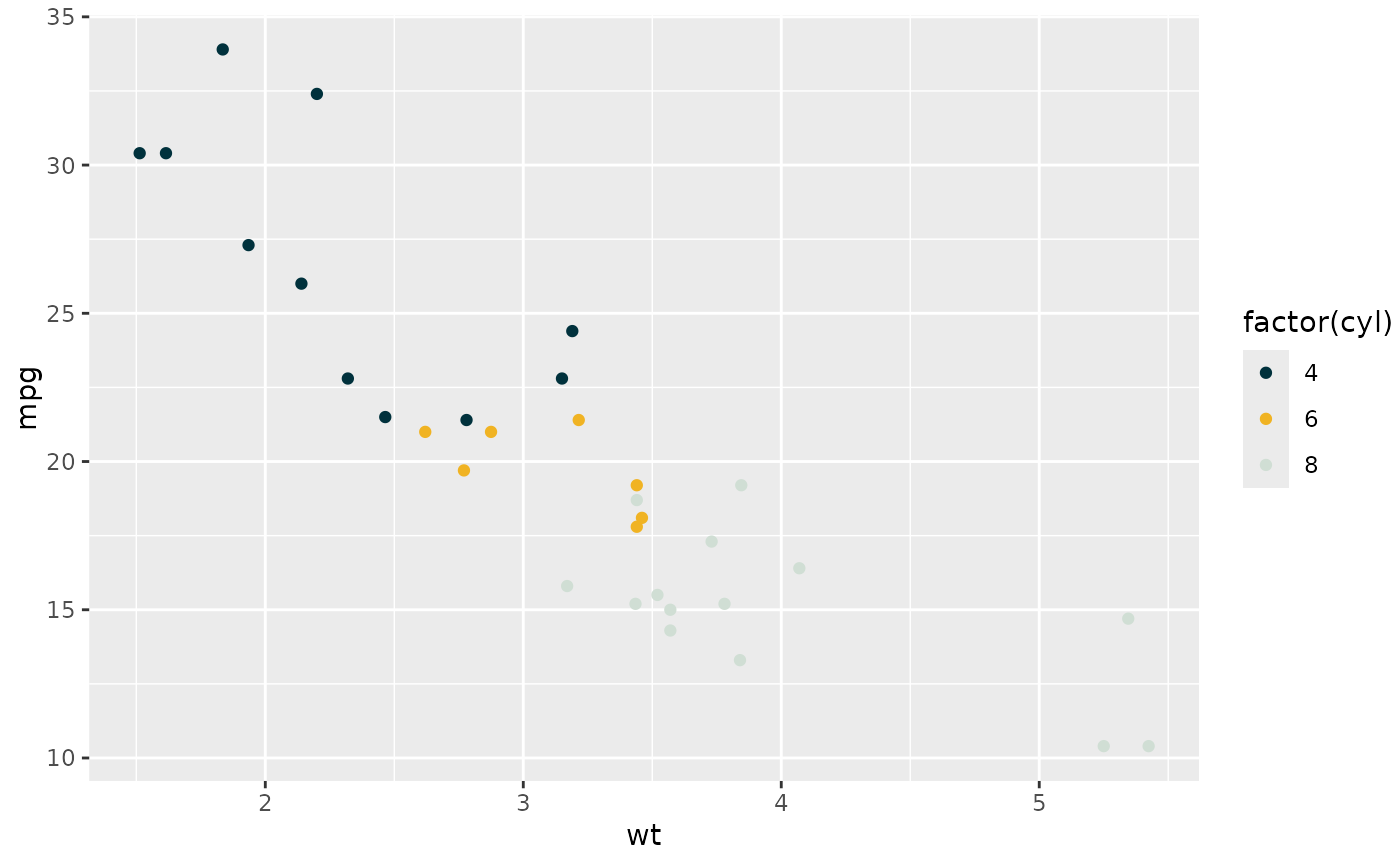
# Basic usage with default palette (3 colors)
ggplot(mtcars, aes(wt, mpg, color = factor(cyl))) +
geom_point() +
scale_color_aiddata()
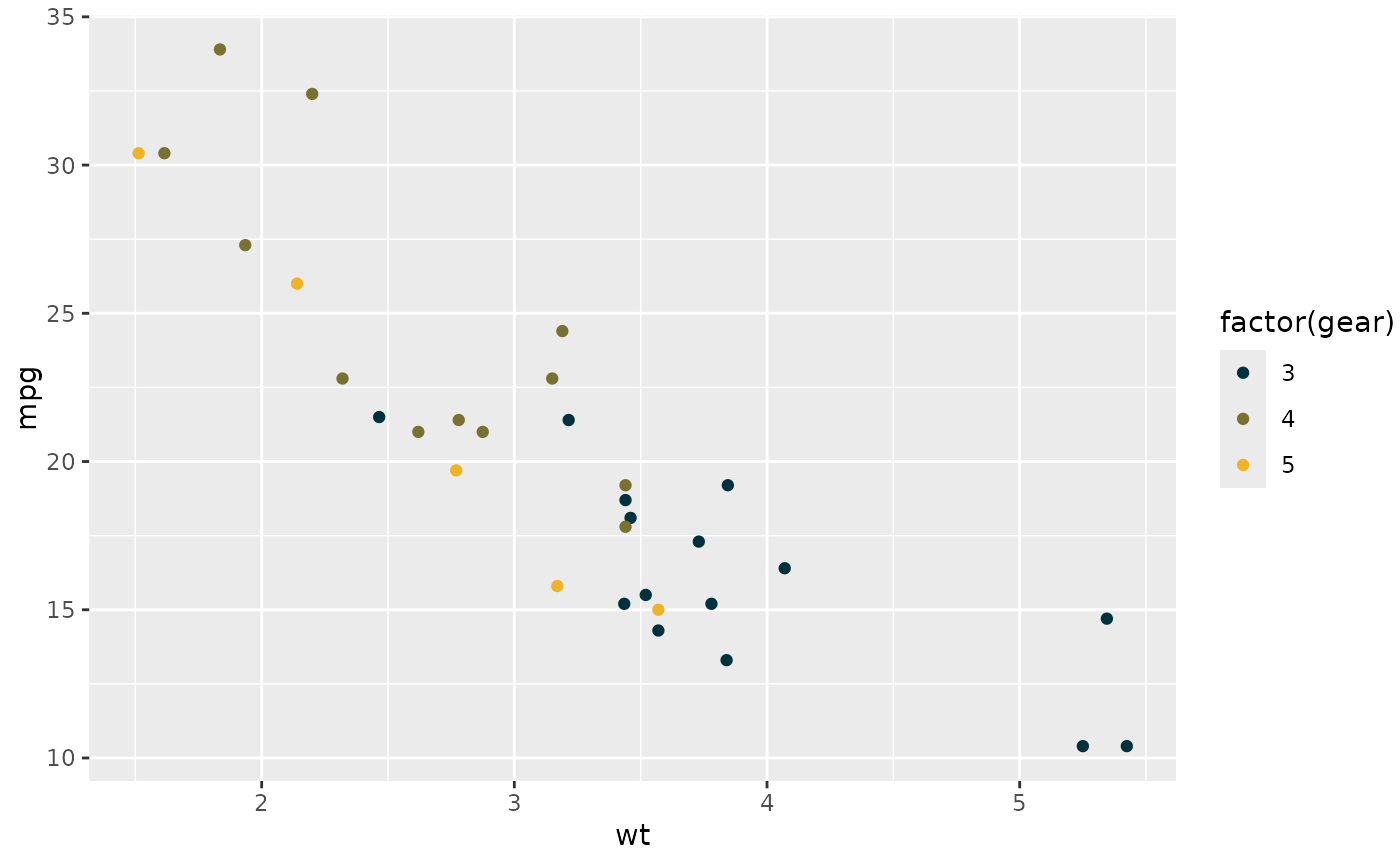
 # Using specific number of colors
ggplot(mtcars, aes(wt, mpg, color = factor(gear))) +
geom_point() +
scale_color_aiddata(palette = "two_colors")
# Using specific number of colors
ggplot(mtcars, aes(wt, mpg, color = factor(gear))) +
geom_point() +
scale_color_aiddata(palette = "two_colors")
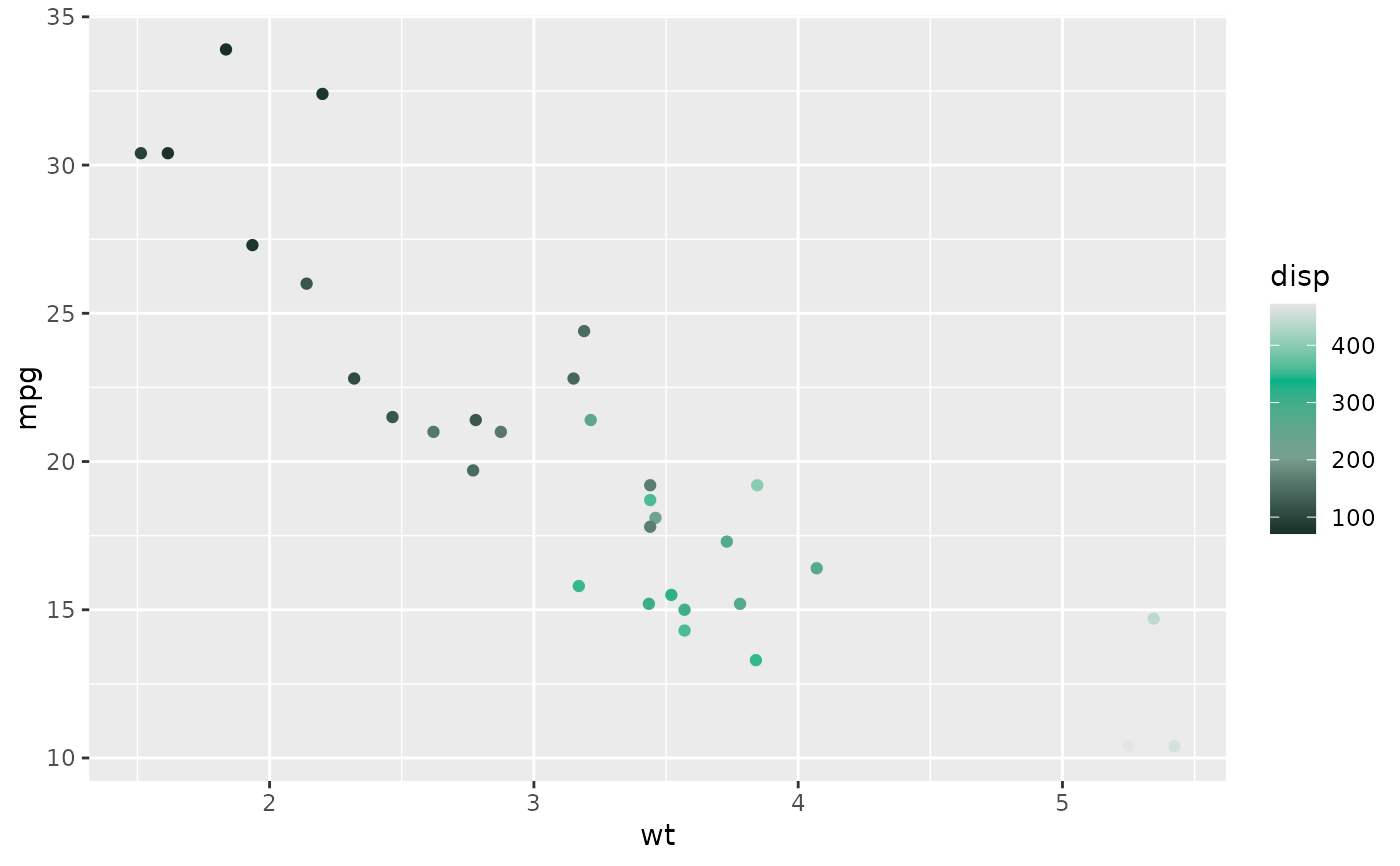
 # Sequential palette for continuous data
ggplot(mtcars, aes(wt, mpg, color = disp)) +
geom_point() +
scale_color_aiddata(palette = "sequential_green", discrete = FALSE)
# Sequential palette for continuous data
ggplot(mtcars, aes(wt, mpg, color = disp)) +
geom_point() +
scale_color_aiddata(palette = "sequential_green", discrete = FALSE)
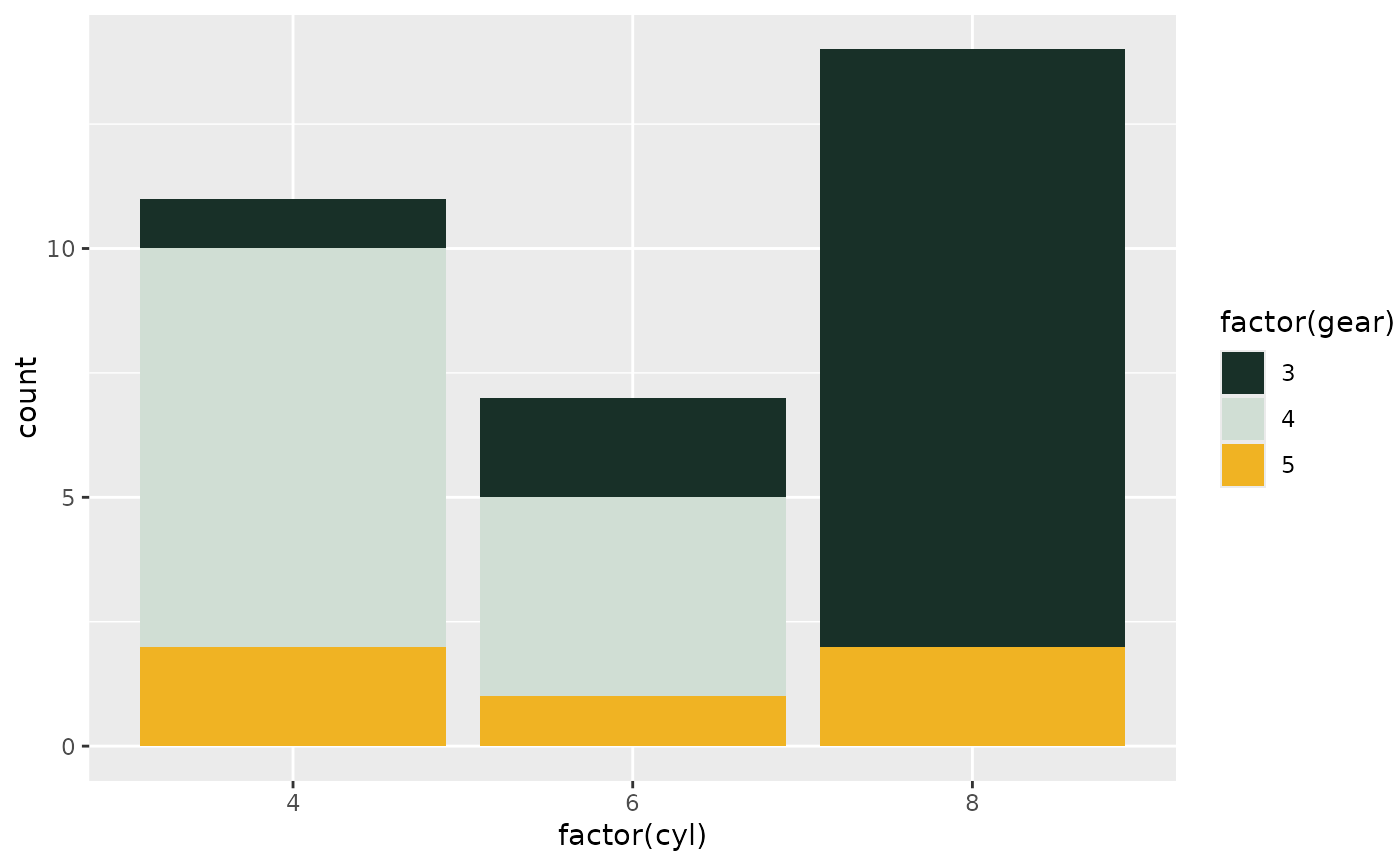
 # Fill scale with diverging palette
ggplot(mtcars, aes(factor(cyl), fill = factor(gear))) +
geom_bar() +
scale_fill_aiddata(palette = "diverging_green_gold")
# Fill scale with diverging palette
ggplot(mtcars, aes(factor(cyl), fill = factor(gear))) +
geom_bar() +
scale_fill_aiddata(palette = "diverging_green_gold")