Visualizing and exporting graphs
GraphViz DOT
from excel_grapher.grapher import to_graphviz

dot = to_graphviz(g, rankdir="LR")
Mermaid
from excel_grapher.grapher import to_mermaid

mm = to_mermaid(g, max_nodes=100)
Path-induced subgraphs for focused visualization
Use select_path_induced_subgraph(...) to isolate only nodes on directed dependency paths between source and target node sets, then pass the smaller graph to any exporter.
from excel_grapher.grapher import select_path_induced_subgraph, to_graphviz

focused = select_path_induced_subgraph(
    g,
    source_keys=["Sheet1!F1"],
    target_keys=["Sheet1!A1"],
    max_path_length=10,  # optional safety cutoff
    max_paths=1000,      # optional safety cutoff
)
dot = to_graphviz(focused, rankdir="LR")
The path search follows graph edge direction (A -> B means A depends on B), validates that all requested keys exist in the graph, and preserves edge guards/provenance in the returned induced subgraph.
NetworkX (optional dependency)
from excel_grapher.grapher import to_networkx

G = to_networkx(g)
Formula text on nodes
For to_graphviz, to_mermaid, and to_networkx, formula cells get a second line in the node label (cell address, then the formula). This is on by default (include_formula_on_nodes=True). Set include_formula_on_nodes=False to use only the cell address. Long formulas are truncated for display: max_formula_length defaults to 120 characters; use None for no limit. Truncated text ends with ....
Large graphs and module inference: NetworkX visualization
For graphs that are too large for Graphviz or Mermaid, the current recommended workflow is:
- DependencyGraph ->
to_networkx(...)->to_web_viz_payload(...) write_web_viz_html(...)for rendering
This builds a NetworkX graph, converts it to a visualization payload, generates a static HTML viewer that wraps the payload, and opens the generated HTML in a browser. The payload stores node coordinates, module/rank metadata, and edge columns; the browser viewer consumes those directly.
from pathlib import Path

from excel_grapher.exporter import to_web_viz_payload
from excel_grapher.grapher import create_dependency_graph, to_networkx, write_web_viz_html

g = create_dependency_graph("model.xlsx", ["Sheet1!A1"], load_values=False)
payload = to_web_viz_payload(to_networkx(g))
write_web_viz_html(payload, Path("model.html"), data_mode="auto")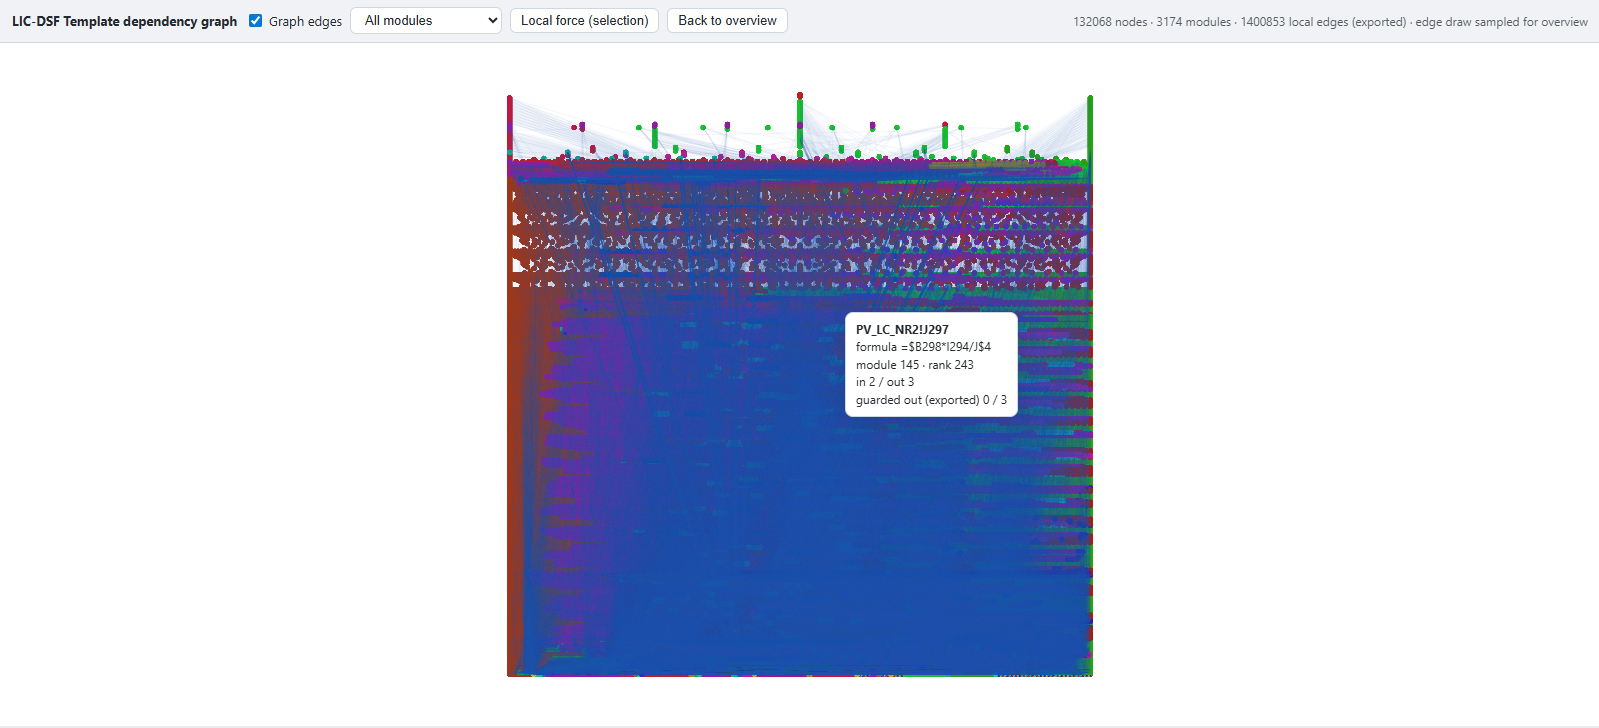
Customizing NetworkX visualization
The payload builder (to_web_viz_payload) and the viewer (write_web_viz_html) are powered by plugins. A single default plugin is provided for each, but you are encouraged to write your own. Configure to_web_viz_payload(...) via:
layout="...": layout plugin id (stratified_multipartitedefault; see list_web_viz_layouts()).layout_config={...}: plugin-specific optional config.include_guarded_edges: include/exclude guarded edges in core/local edge export.include_guarded_edges_for_partition: include/exclude guarded edges in module partitioning.include_module_overlay: include partition overlay metadata and module color semantics.
Default layout: stratified_multipartite
The default layout is stratified_multipartite, which uses SCC-condensation longest-path rank on the vertical axis and Louvain community ordering on the horizontal axis.
from excel_grapher.exporter import to_web_viz_payload, list_web_viz_layouts
from excel_grapher.grapher import write_web_viz_html

payload = to_web_viz_payload(
    G,
    layout="stratified_multipartite",  # default
    layout_config=None,                # plugin-specific options
    include_module_overlay=True,       # include Louvain partition overlay
)
write_web_viz_html(payload, "model-web.html", data_mode="auto")
This layout is partly intended to inform refactoring and modularization of generated code. Interpret the viewer with this mental model:
- Position:
x/y- SCC-rank vertical strata and Louvain-based horizontal ordering. - Color: node color maps to
module_id(partition/community id). With no module overlay, all nodes are one module color. - Edges: overview prefers node-level
local_edges; if unavailable, it falls back to module-centroid edges. - Label
Module edges/Graph edges: reflects which edge set is currently drawn in overview. - Rank in tooltip is node rank metadata and may differ from visual layering for force-directed layouts.
excel_grapher.exporter.to_web_viz_payload(...) includes the partition overlay by default and is the canonical payload entrypoint for this visualization workflow. Open the exported HTML directly in a browser. The interface supports panning, zooming, hover tooltips, and a local force-layout mode for inspecting a neighborhood around a selected node.
Validation via calcChain.xml
You can validate the graph against Excel’s calcChain.xml:
from pathlib import Path

from excel_grapher.grapher import create_dependency_graph, validate_graph

g = create_dependency_graph("model.xlsx", ["Sheet1!A10"], load_values=False)
res = validate_graph(g, Path("model.xlsx"), scope={"Sheet1"})
print(res.is_valid, res.messages)
If xl/calcChain.xml is missing (common for generated files), validation returns is_valid=True with an informational message.